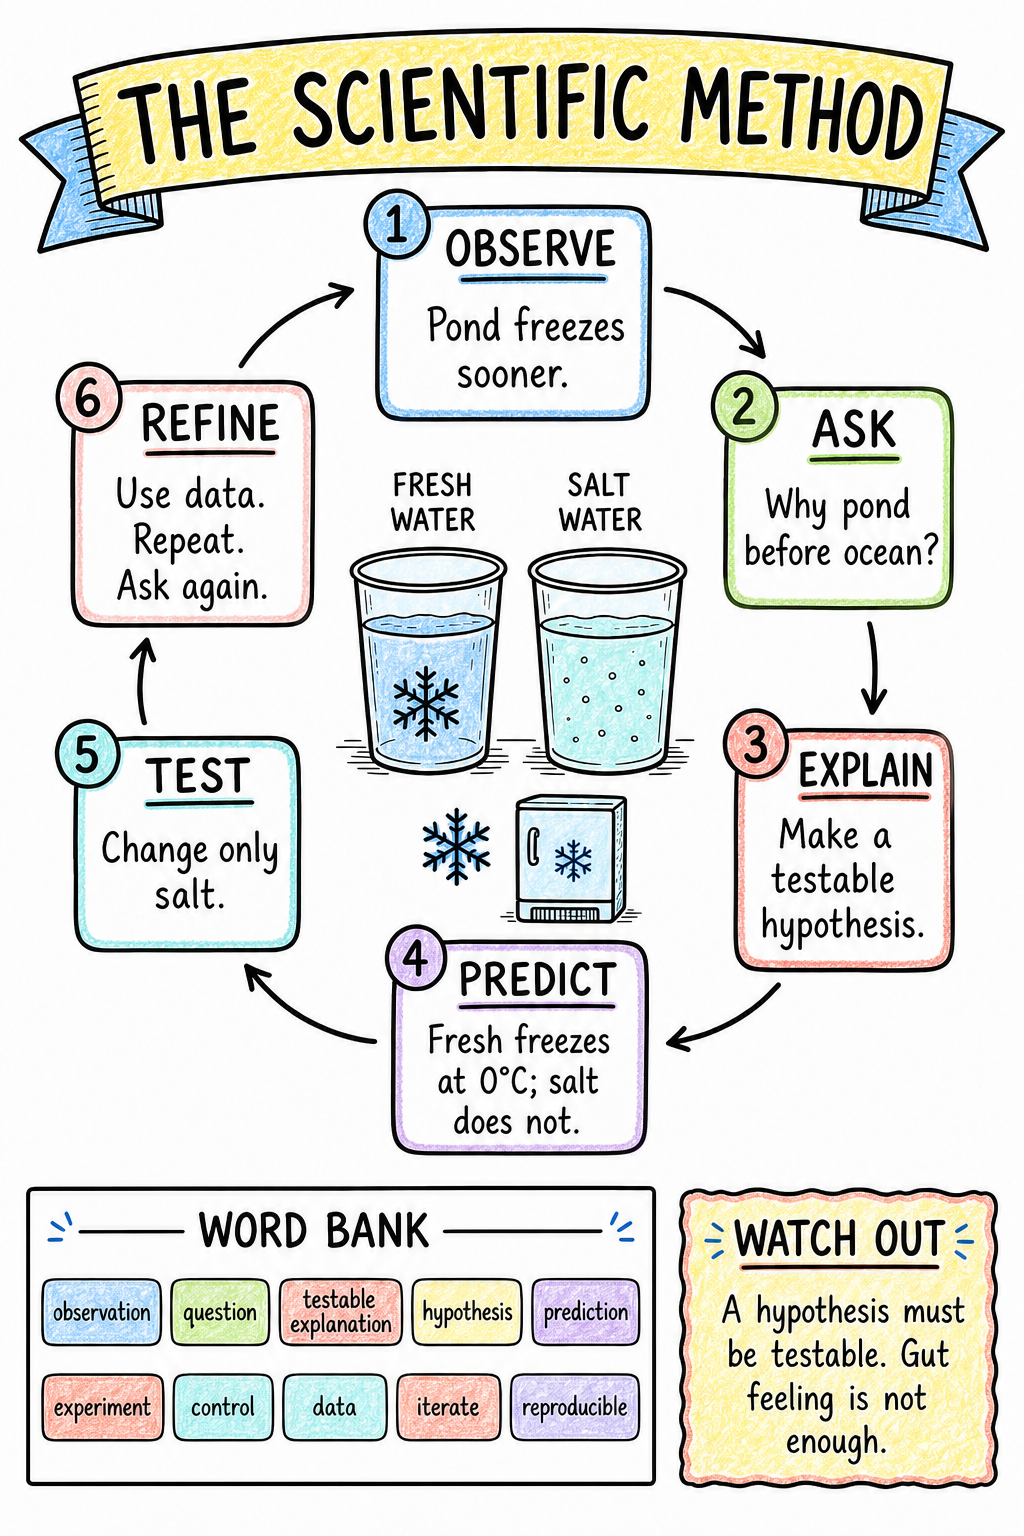
 Test your ideaChange the cups. Keep the test fair. Add notes and color as you go.Open Scientific Method interactive sketchnote
Unit 03 · Toolkit · 7th & 8th grade
It's not a recipe.
It's a loop.
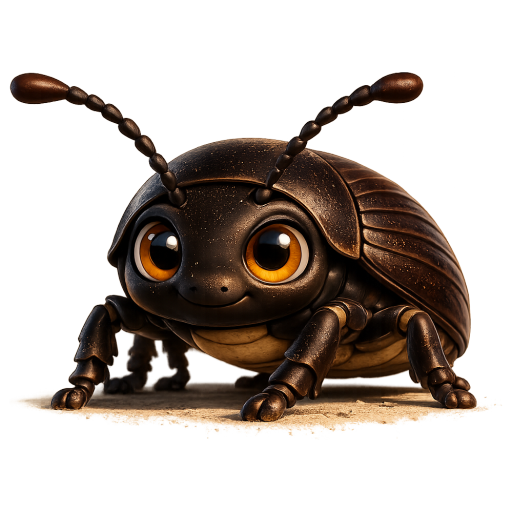
Textbooks draw the scientific method as a straight line of steps. Real scientists know better: it's a cycle of questions, tests, and arguments that never really ends. Scroll down and do it — observe, sort, test, graph, and argue, with one very cooperative beetle.
Scientific Method · investigations, measurement and graphing
tap a node to jump to its step
Watch · video lessons
From a question to a graph that tells the story
Measurement companions
Manipulative · Session study
Say it like a scientist
Investigation and measurement words plus myth cards. Flip, type, or match them, listen if you like, and choose whether you know each one or want to test it again later in this session. More units join your deck as we unlock them. Nothing is saved and no account is needed.
Read · Eleo explains
The beetle's commentary track
A companion article for the video — same loop, beetle's mouth. Read it before or after; he doesn't grade order. The audio version lands when Mr. U records it.
Measurement companions
A Beetle Is Not a Unit · 2 min read
A number needs a shared unit
Imagine I report that a book is twelve beetles long. Which beetle? A different-sized beetle gives a different count. A shared length unit lets two people compare their measurements. A useful measurement includes a number and a unit: 24 cm tells you more than 24.
One meter, many useful sizes
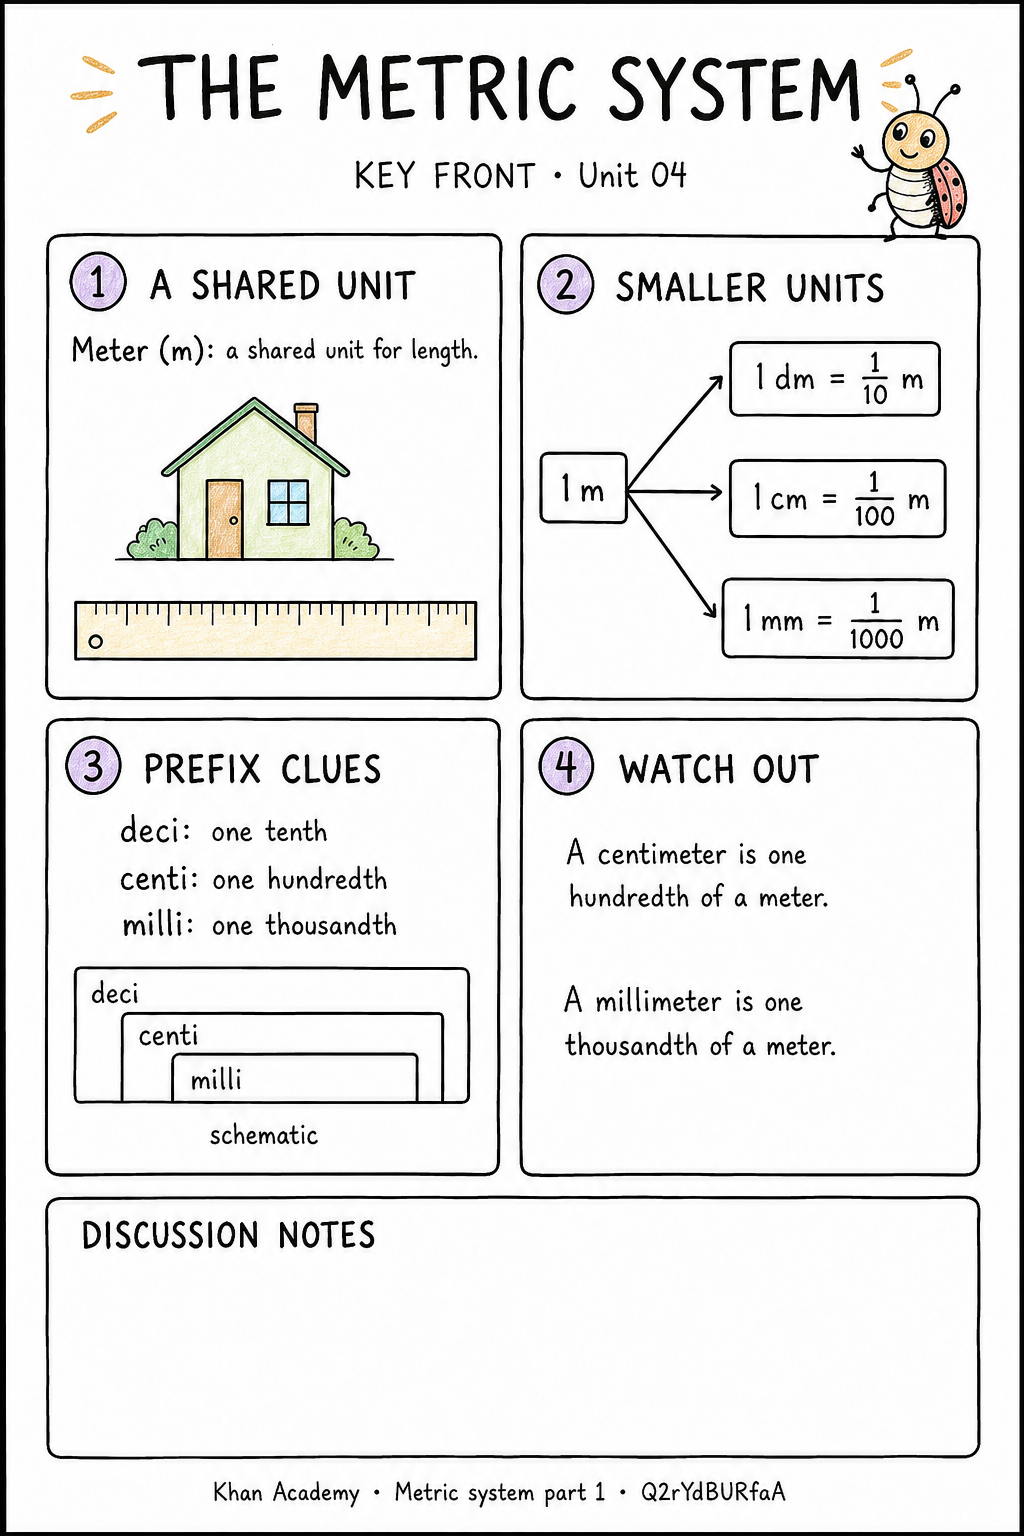
The meter (m) is the base unit for length. A decimeter is one tenth of a meter, a centimeter one hundredth, and a millimeter one thousandth. A kilometer is 1,000 meters. Prefixes tell you how the unit compares with the meter. Choose a size that makes your measurement easy to read and communicate.
The object stays the same
A 24 cm book edge is also 240 mm long. The book did not grow: smaller units mean more units fit along the same edge. These are authored classroom examples, not measurements taken from the video. Check them with a ruler and the relationship 1 cm = 10 mm.
Agreement is only the beginning
Shared units make comparisons possible; they do not guarantee accurate readings. Line up the zero mark, check the smallest divisions, and read from a consistent position. On an analog scale, record the marks you can read and one reasonable estimated digit. A digital display does not justify inventing extra digits.
Try it on paper
Measure one book edge three times, starting again each time. Keep every reading, including one that seems unusual. Could the tool, alignment or your reading procedure explain a difference? Explain your evidence before changing the record. — Eleo, temporarily retired as a unit of length
Ten at a Time · 2 min read
Same amount, different count
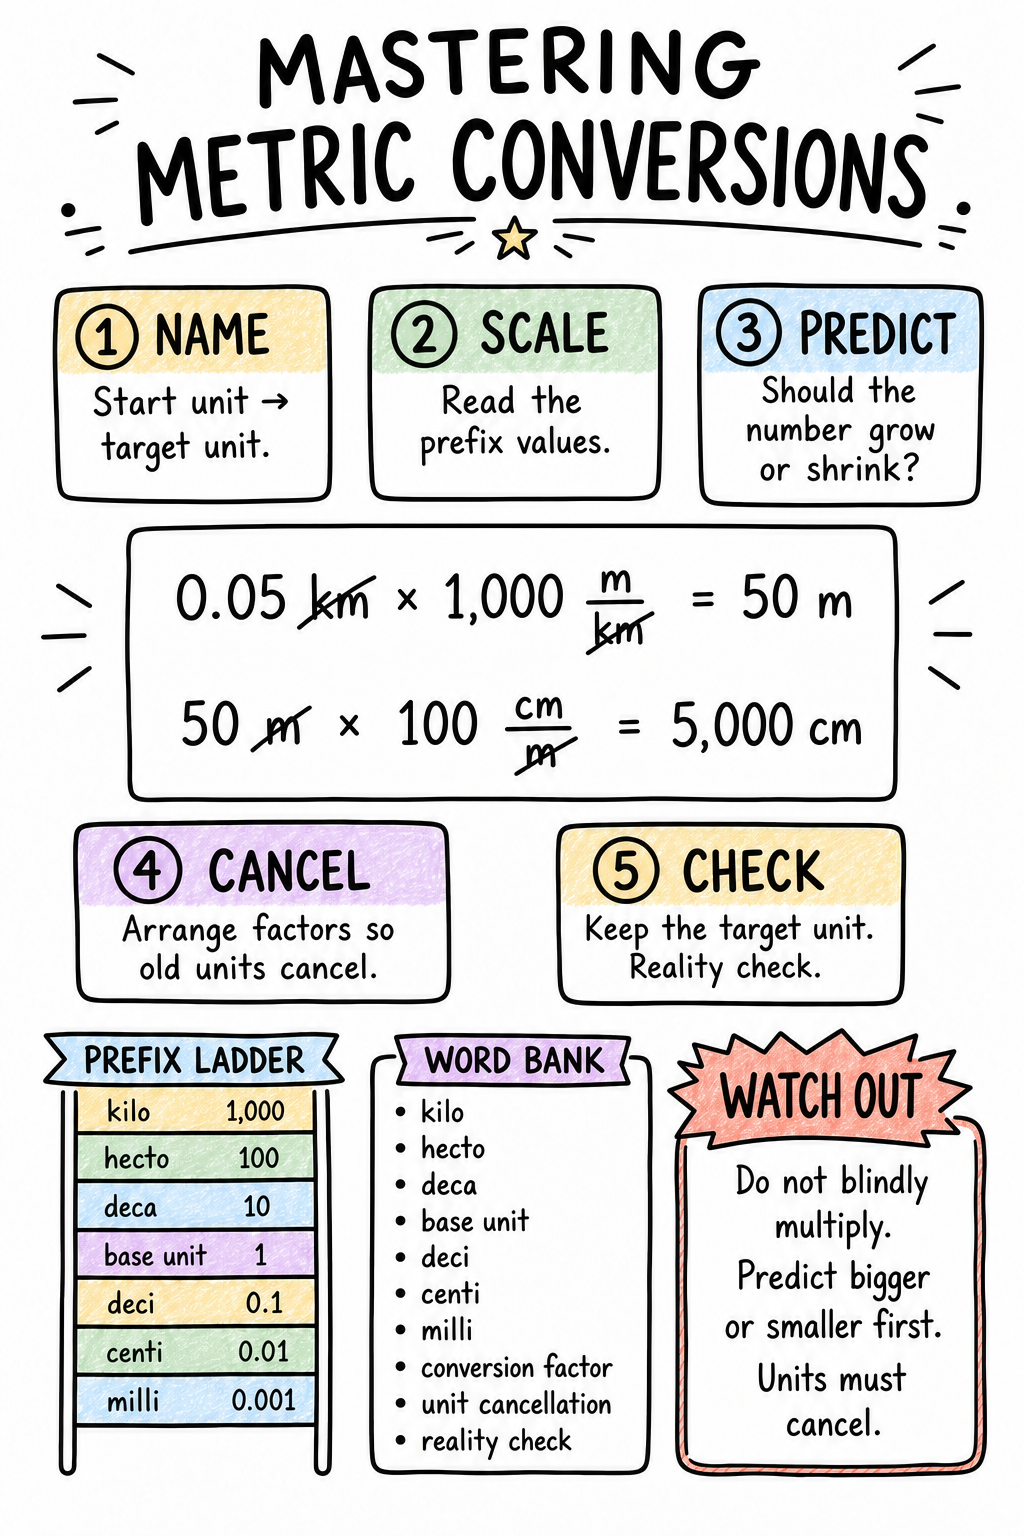
Converting a measurement changes its unit, not its amount. Smaller units require a larger number for the same quantity. Before calculating, predict whether the number should increase or decrease.
A relationship you can use
One meter equals 100 centimeters. So 2.7 m × (100 cm / 1 m) = 270 cm. The meters cancel, leaving centimeters. The ratio compares equal lengths, so it has a value of one. This is an authored worked example using the conversion method in the video.
Count the factors, not the jumps on the page
The full metric ladder changes by a factor of ten at each adjacent rung: kilo, hecto, deca, base, deci, centi, milli. A shortened display skips rungs. From kilometers to meters is a factor of 1,000; from meters to centimeters is 100. Do not treat every visible jump as a single factor of ten.
Reverse the conversion
For 270 cm to meters, use 270 cm × (1 m / 100 cm) = 2.7 m. Centimeters cancel. A larger unit needs a smaller count. Reversing your conversion is one way to check that the amount stayed the same.
Use it, then explain it
Convert your book measurement from centimeters to millimeters and back. Write the unit on every answer. Explain why the book cannot get longer just because its measurement has a larger number. Use the converter below after trying the calculation on paper. — Eleo, same beetle in every unit
Sketch · sketchnotes
Draw it to know it
Pick a drawing and make it yours, or print a workbook to fill in while you watch. Doodling counts as studying here.
Test your ideaChange the cups. Keep the test fair. Add notes and color as you go.Open Scientific Method interactive sketchnote
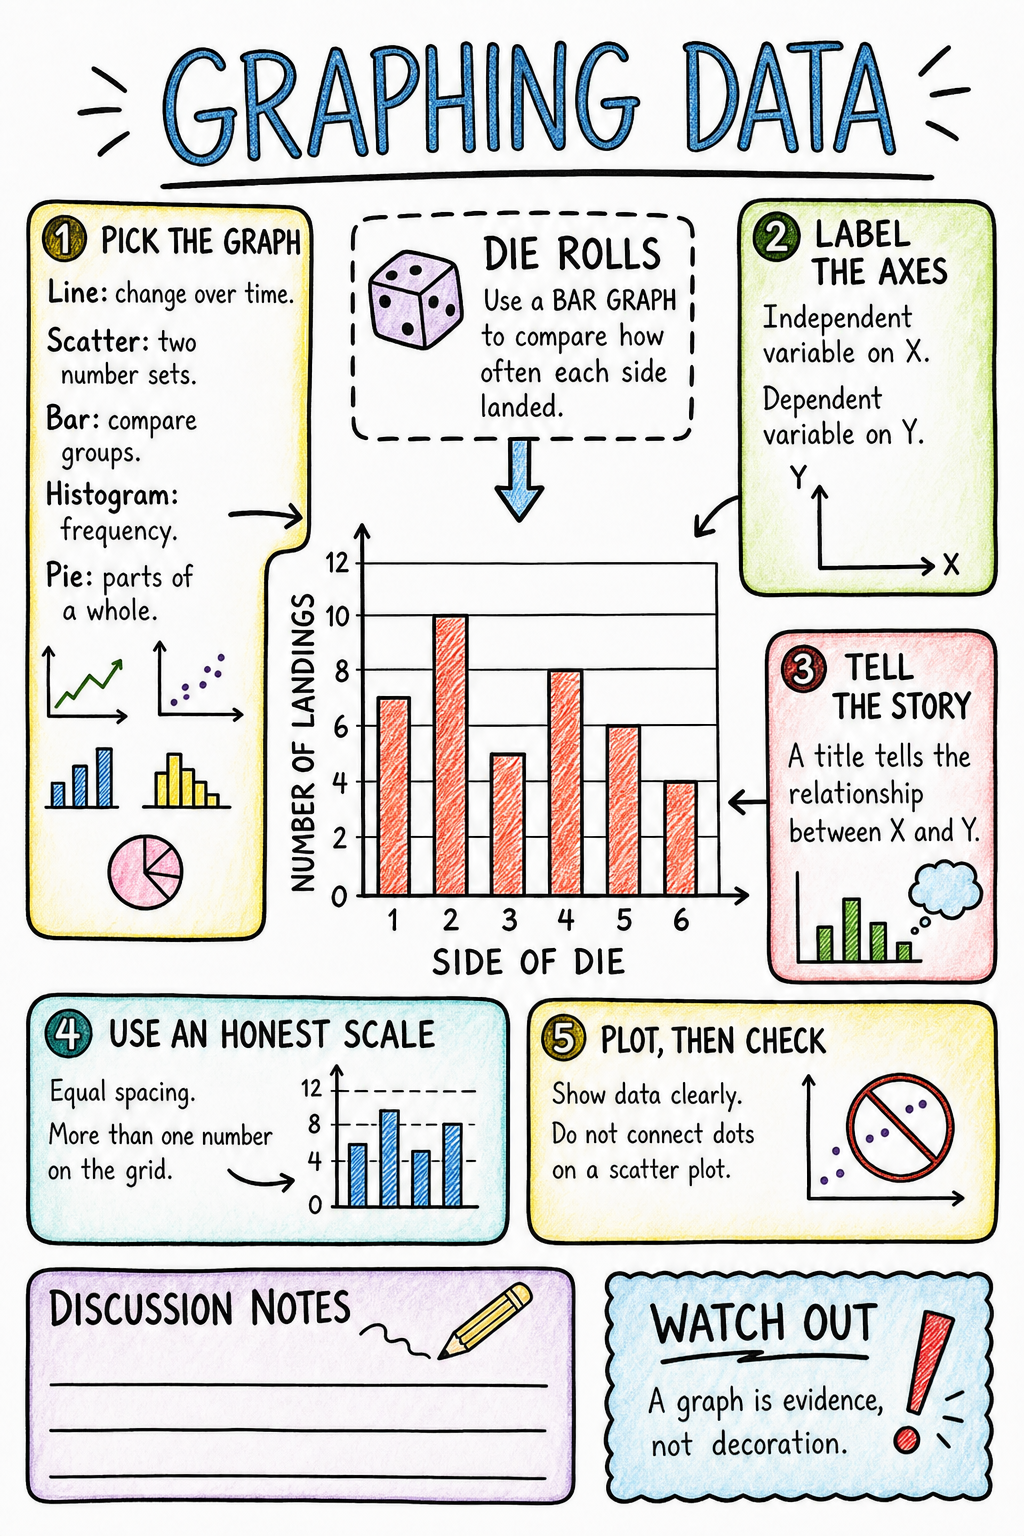 Find the storyMove a point. See what changes. Add notes and color as you go.Open Graphing Data interactive sketchnote
Making graphs · sketchnotes
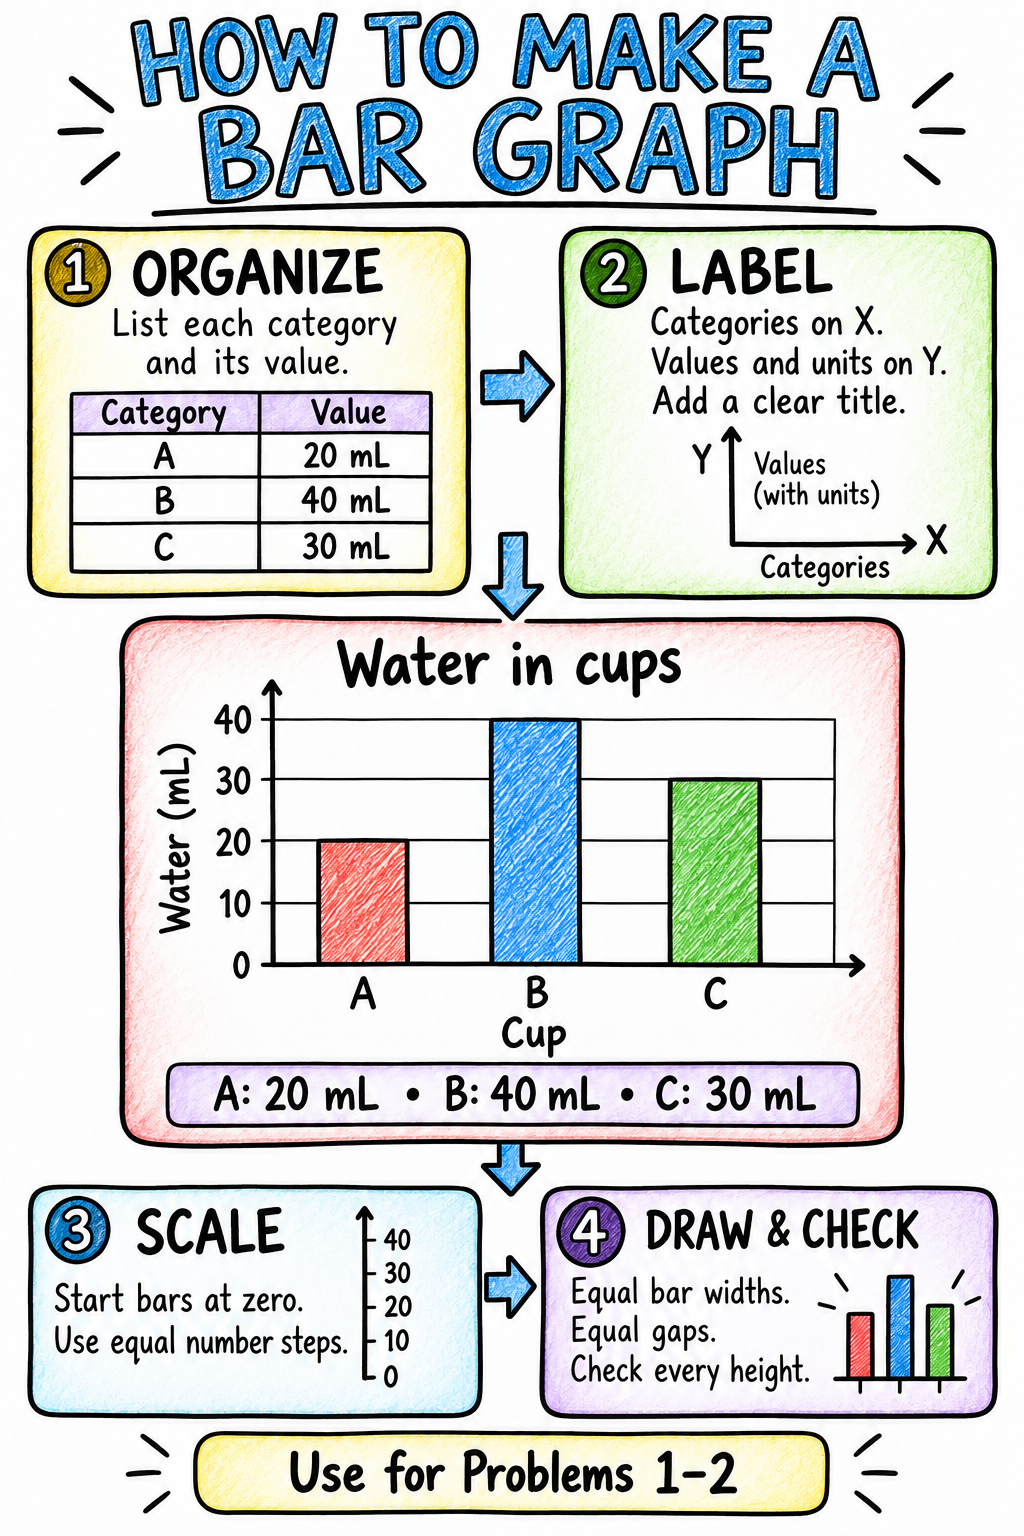 Shape the barsChange a value. Make the comparison. Add notes and color as you go.Open Bar graph interactive sketchnote
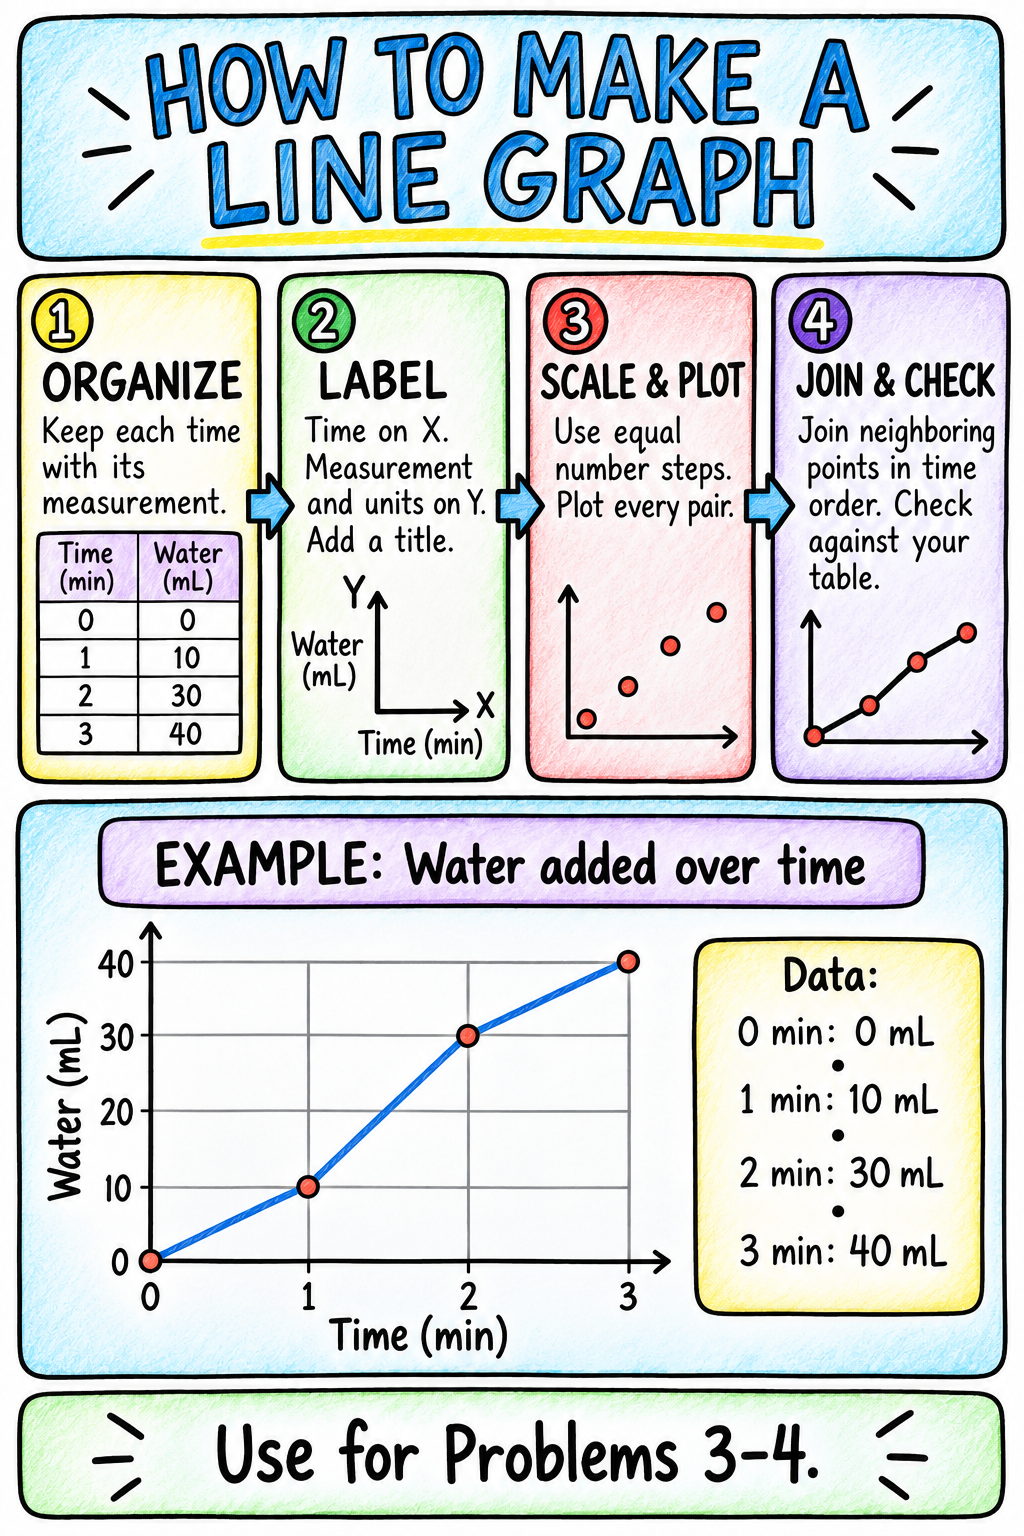 Follow the changeMove a point. Trace the story. Add notes and color as you go.Open Line graph interactive sketchnote
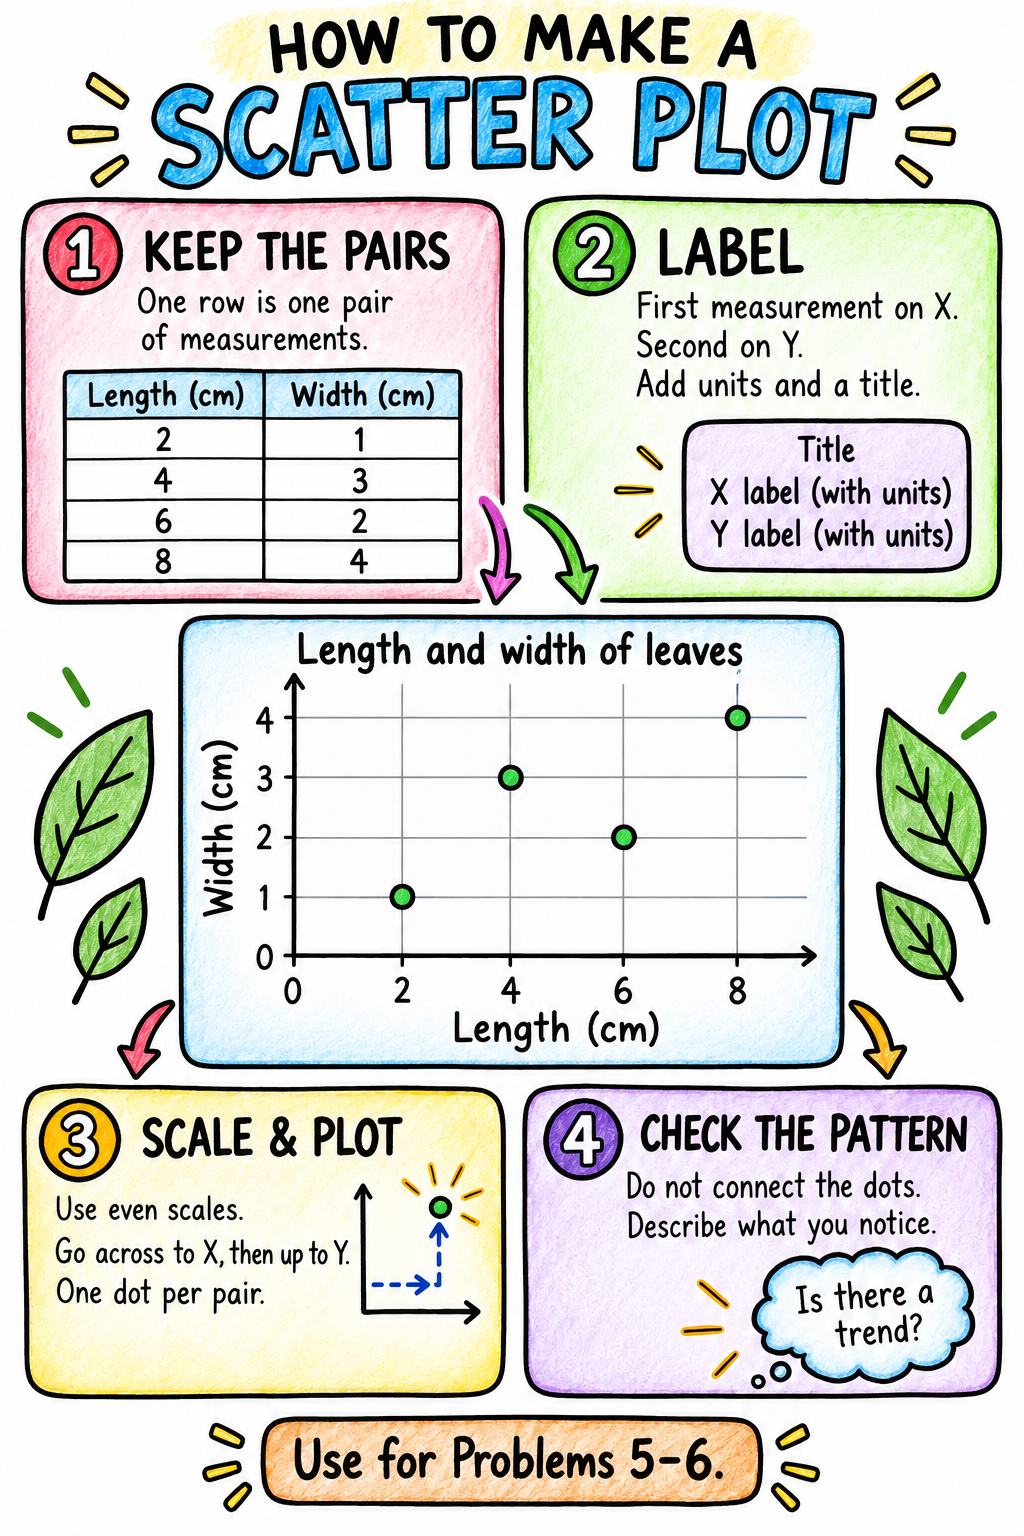 Spot the patternTry a new pair. See where it lands. Add notes and color as you go.Open Scatter plot interactive sketchnote
Scatter plot · Scientific Method
Look for a relationship between two measurements.
workbook blank sheet
reference filled-in sheet
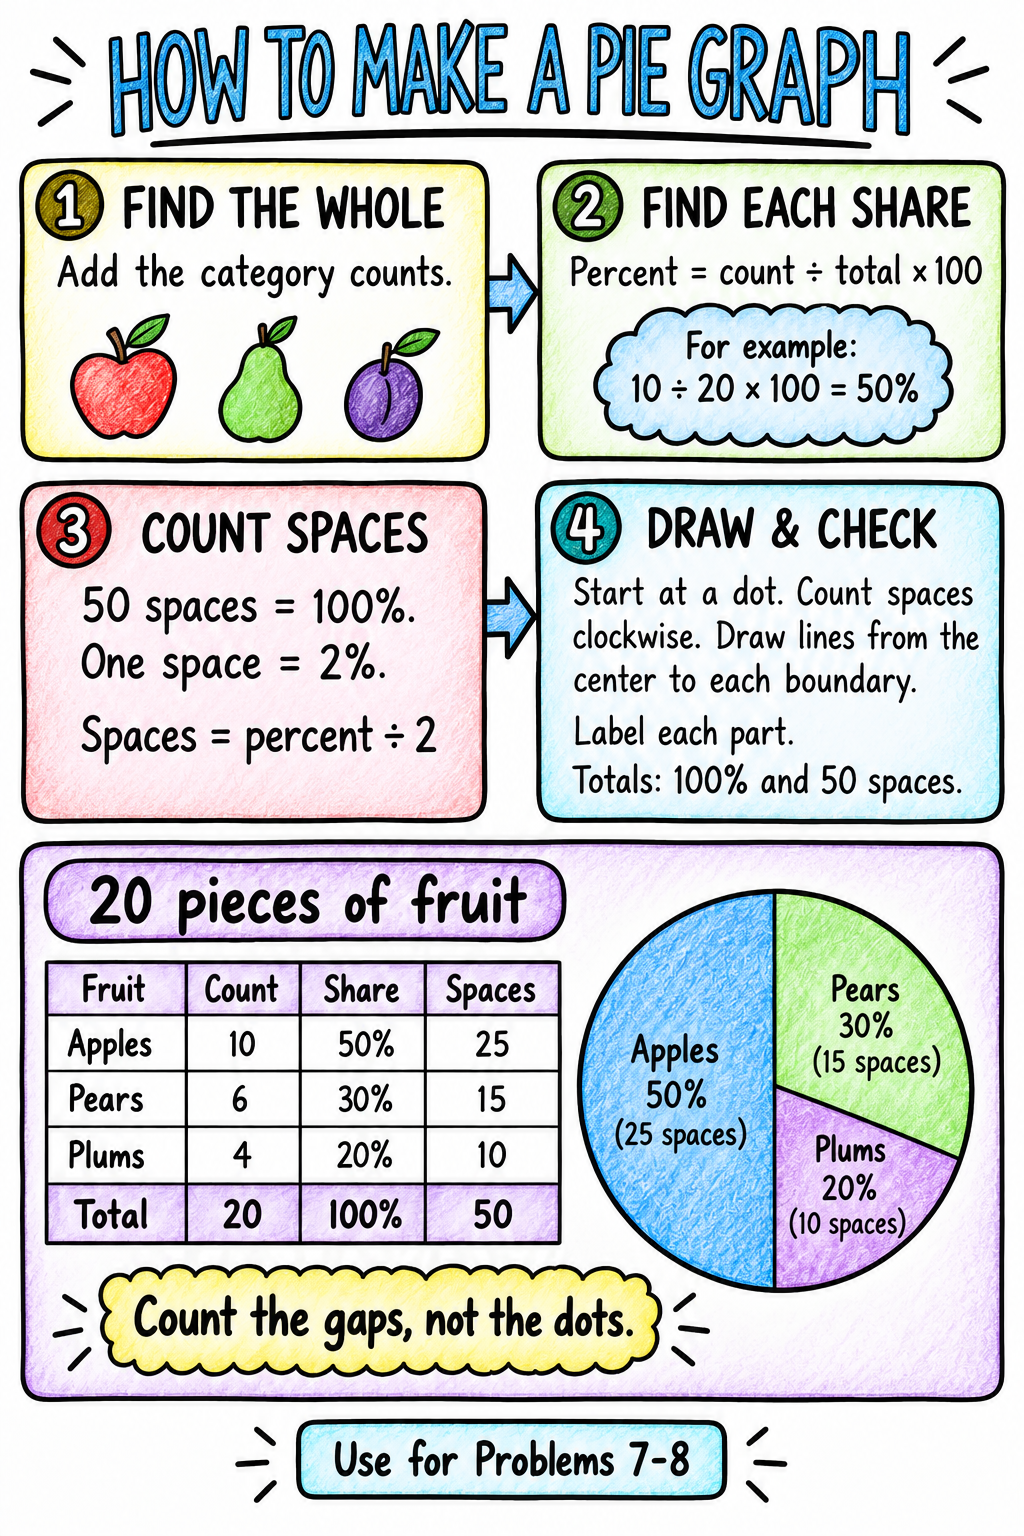 Share the circleChange the parts. Keep one whole. Add notes and color as you go.Open Pie graph interactive sketchnote
Pie graph · Scientific Method
Show parts of one whole.
workbook blank sheet
reference filled-in sheet
Measurement companions
Investigate · Performance expectations
Your prediction vs. the real world
Pick a question, make a prediction, and let a real measurement push back. The field guide gives you a paper-first path; the labs add optional browser tools when they make the evidence easier to see.
Experiment 1 · chance
How many times will it land on 1?
Predict, collect 100 raw rolls, then export them to Google Sheets to compare landed on 1 with did not land on 1 in your own table, bar graph, and circle graph.
Open Experiment 1 → physical die + local data tools
Science practices · SEP 1–8
Inquiry Studio field guide
Mystery boxes, paper helicopters, graph repairs, sample detectives, and a mini conference — choose the investigation that fits your room.
Open the print-first guide → student-collected + modeled data
Measurement application · both grades
From measurement to evidence
Measure a book edge, keep the raw readings, and defend a claim. Use the graph task to apply what you learned in graphing practice.
Open the investigation → Student PDF → your measurements + labeled practice dataPractice · Math skills
Data or it didn't happen
Start with the guided Graph Workshop to build and interpret line graphs, scatter plots, and pie graphs on screen. Then use the word problems for more practice with tables, explanations, and paper graphs.
Assessment · 12 multiple-choice answers · about 25 minutes
Graphing test
Use your paper sketchnotes, graph tools and calculator. Choose your answers, then transfer your letters to Canvas.
Open the graphing test → Test prep · 8 questions · about 30 minutesGraphing practice test
Build bar, line, scatter and pie graphs. Try it on your own, then review the explanations and correct your work.
build + interpretscales + evidencefeedback + retry Try the practice test → Unit #03 · guided first lesson · both gradesGraph Workshop
Learn line graphs, scatter plots, and pie graphs. Build on screen, get help at each step, and find the story in your data. No paper needed for the first lesson.
scales + plottingsketch notesguided review Start the graph workshop → Unit #03 · computer activity · 8 problemsEight graphing problems
Open the activity, read each science story, and type into its table. Make six graphs on grid paper and two pie graphs on the 50-dot circles.
editable tablesbar / line / scatterpie graphs Start on the computer → Unit #03 · interactive test reviewBar Graphs Review
Build, read, repair and question bar graphs. Explore twelve stations, run a sampling experiment, or try a practice test.
digital graph buildergraph detectivepractice test Open the graph workshop → Unit #03 · both grades · worksheetData or It Didn't Happen
Sample size vs. loud opinion, the outlier that drags the mean, graph detective work, and demanding the numbers behind "4 out of 5."
expected vs. observedmean & mediangraph literacy Open the sheet → Unit #03 · both grades · investigation guideInquiry Studio field guide
Plan a fair test, record repeated measures, repair a graph, audit a claim, or run a bounded peer-review conference.
variables & controlssample sizeCER + revision Open the guide →
Graphing studio · choose a display
Pick the graph that tells the story.
Different questions need different graph shapes. Switch the example, then use the checklist before you call a pattern evidence.
Example data · bar graph
Use it when
Compare separate categories
A bar graph makes the size of each category easy to compare. Leave space between bars because the categories are separate.
Example data: a beetle stayed head-up most often in shadow.
Showing a bar graph example.
Before you call it evidence
- Titlesay what was measured
- Axesname both variables
- Unitsinclude cm, s, or another unit
- Scaleuse even steps from zero when it fits
- Patterndescribe what the data actually shows
Black-and-white print sheets: two blank grids per page, four on one double-sided sheet (flip on long edge). The separate pie-graph page has two circles with 50 dots each; each space is 2%.
Scientific Method · measurement
Give your evidence a unit.
Choose a tool, record what you measured, and make it possible for someone else to repeat your test.
Choose a tool: five instruments and a notebook
Ruler or meter stick
Length · mm, cm, m. Align the zero mark with your endpoint. Check the smallest divisions, then estimate one reasonable extra digit on an analog scale.
Graduated cylinder
Volume · mL, L. Read at eye level. For water's concave meniscus, use the bottom of the curve.
Balance
Mass · g, kg. Zero the balance first. Mass describes the amount of matter; weight is a gravitational force.
Thermometer
Temperature · °C. Wait for the reading to settle. Record the unit and use the instrument as directed.
Stopwatch
Time · s, min. Agree on the start and stop events. Repeated trials help you inspect variation; they do not automatically remove a shared timing error.
Eyes and notebook
Observations and raw records. Write each reading with its unit and note what happened. Keep unusual results so you can investigate them.
Accuracy, precision and the estimated digit
Accuracy: closeness to a trusted reference. Precision: agreement among repeated measurements. Closely grouped readings can all be wrong by a similar amount.
- Close together and near the reference: precise and accurate.
- Close together but far from the reference: precise; check calibration or procedure.
- Spread around the reference: less precise; inspect the variation.
- Spread out and away from the reference: check both the tool and the procedure.
Estimated digit: if an analog ruler's smallest marks are 0.1 cm apart and the edge is halfway between 4.3 and 4.4 cm, a reasonable reading is 4.35 cm. Extra displayed decimal places alone do not establish accuracy.
Check your thinking: three clocks agree. Does that prove accuracy?
No. They may share a timing or calibration error. Compare with a trusted reference and inspect the procedure.
Try it · a ruler, a book, a question
Could someone repeat your measurement?
Start with a prediction.
Estimate the length of one book edge in centimeters. Place the book flat on your desk and choose the same two endpoints for every reading.
- Check the ruler's zero mark and smallest divisions.
- Measure the edge, then lift and realign the ruler. Repeat three times.
- Record every reading with cm. For an analog ruler, include one reasonable estimated digit beyond its marks.
- Convert one reading to mm. Explain why the length stayed the same.
Metric relationships · the amount stays the same
One system, ten at a time
A smaller unit gives a larger number for the same length. Use a conversion factor to express the same measurement in another unit: 4.2 cm × (10 mm / 1 cm) = 42 mm. Each adjacent step on this length ladder changes the unit size by a factor of ten.
km×10 →
hm×10 →
dam×10 →
m×10 →
dm×10 →
cm×10 →
mm
King Henry Died By Drinking Chocolate Milk — B marks the unprefixed unit on this classroom ladder: meter, gram or liter. The meter is the base unit for length; not every unprefixed unit is an SI base unit.
4.2 cm = 42 mm
1 cm = 10 mm. Multiply by 10; the length stays the same.
Paper packet example · keep the original record
One unusual number. Two summaries.
Five authored practice times from your paper packet: 4.8, 5.0, 4.9, 8.0, 5.3 seconds. Predict how the 8.0 s reading affects the mean before comparing.
Compare the calculations
All five: sum 28.0 s; mean 5.6 s; median 5.0 s; range 3.2 s.
Without 8.0 s: sum 20.0 s; mean 5.0 s; median 4.95 s; range 0.5 s. The extra decimal in the calculated median is not extra instrument precision.
This comparison shows sensitivity to one value. It does not give permission to delete that value.
Paper packet: interpret the time–position record
Authored practice data from the measurement packet. Use Scientific Method graphing practice for help choosing axes and scale.
| Time (s) | Position (m) |
|---|---|
| 0 | 0 |
| 1 | 1 |
| 2 | 2 |
| 3 | 2 |
| 4 | 4 |
| 5 | 6 |
Draw the graph. What happened between 2 and 3 seconds? Compare the change in position from 0–2 seconds with 3–5 seconds.
After your attempt: explain the evidence
Position stays at 2 m from 2–3 s: the object is stationary in this model. It moves 2 m from 0–2 s and 4 m from 3–5 s. Over equal two-second intervals, the second change is twice the first. Lines between recorded points are a model, not additional measurements.
Myth-busters · tap to flip
Unlearn these three things
Exit ticket · 5 questions
Before you leave the lab
No grade, no stakes — just proof the loop stuck. Answer all five to earn the stamp.
question 1 of 5
The loop, starring Eleodes
Six steps, zero shortcuts
Read the story once — then play every step below. Each card is one move in the loop; the beetle runs it with you.
Observe & wonder
Science starts with noticing something weird and refusing to shrug it off. Slow down. Look closer. Write it down.
Eleodes tips onto his head whenever he's bothered. Nobody taught him that. Why?
SEP 1
Ask a question
Good questions are specific and testable — they start with why, how, or what if. "Are beetles cool?" is not a question science can answer. (The answer is yes anyway.)
Is the headstand a defense against predators — or just a weird hobby?
SEP 1
Hypothesize
A hypothesis is not a guess. It's a testable prediction with a reason attached: "If this, then that, because here's my thinking."
If the headstand is defense, then beetles will do it more when something predator-like appears, because the pose aims their chemical glands.
SEP 2SEP 6
Test it — fairly
Change one thing (independent variable), measure one thing (dependent variable), keep everything else the same (controlled variables). More trials = more trust. And rule zero: observe, never harm.
Show many beetles gentle, predator-ish stimuli — a shadow, a puff of air, a soft brush — and count the headstands. Nobody gets squirted. Everybody wins.
SEP 3
Analyze the data
Tables become graphs, graphs become patterns. Count it, average it, graph it — then let the numbers talk. (This is where Measurement & Graphing pays rent.)
Headstands per stimulus, graphed: shadow and brush score high, air puff scores low. Pattern detected.
SEP 4SEP 5
Conclude & argue
Make a claim, back it with your evidence, explain your reasoning — then let others poke holes in it. That's not rude, that's science. And every answer ends with a better question.
Verdict: defense confirmed — and the smell does the heavy lifting (quinone chemistry). New question: is the pose a warning before the spray? Loop back to step 01.
SEP 6SEP 7SEP 8
Manipulative 01 · Field skills
The observer's eye
An observation is something you detect directly — you saw it, measured it, counted it. An inference is a story your brain builds from observations. Both are useful. Only one is data. Sort the field notes: observation or inference?
Pick a note, then file it in the right column.
Observation
you saw / measured it
Inference
your brain's story
0 / 8 filed
Manipulative 02 · Question quality
Testable, or needs a rewrite?
A testable question can be answered with evidence from an investigation — something you could actually measure. Opinions, vague words, and crystal-ball questions get sent back. Sort these.
Pick a question, then stamp it.
Testable
measurable with an investigation
Needs a rewrite
vague, opinion, or untestable
0 / 8 stamped
Manipulative 03 · Step 03
Build a hypothesis
If + then + because. Pick one of each — watch your hypothesis assemble itself, and check that it earns all four stamps.
- If — the variable you change on purpose
- Then — the outcome you predict, measurable
- Because — your reasoning, the science behind it
If I change ___ , then ___ , because ___ .
✓ names the variable
✓ makes a prediction
✓ gives a reason
✓ testable & measurable
Manipulative 04 · The virtual lab
The Headstand Lab
Hypothesis on the table: the headstand is a defense. You have five beetles, four stimuli, and unlimited trials — rule zero applies (observe, never harm). Run trials, watch the graph grow, and notice what more data does to your confidence. Then argue your verdict.
Arena · 5 adult Eleodes
no trials yet
pick a stimulus first — everything else stays controlled: same beetles, same arena, same day.
Field notebook
| # | Stimulus | Headstands | Rate |
|---|---|---|---|
| your trials will land here | |||
Headstand rate by stimulus% of beetles per trial
the little bar under each column is your trust meter — it grows with trials. Watch what 5 more trials does to a wobbly average.
Pool class datateacher-entered, no accounts
Add a class team's totals to see how a larger denominator changes the story. Keep trials and headstands as raw counts.
No pooled data yet.
STEP 06
Argue your verdict
Locked — the reviewers want at least 5 trials of two different stimuli before they'll read your claim.
peer
reviewed
reviewed
Inquiry Studio · browser bench
Paper first. Numbers second. Claims last.
Build two paper helicopters, change one variable, and run repeated drops. The calculator keeps the arithmetic honest; your explanation still has to do the thinking.
SM-02 · fair test
Paper Helicopter Bench
Use seconds from release to floor. Keep the drop height, paper, release method, and timer the same. Change one design feature only.
7th grade: mean, median, range, and a dot plot. 8th grade: compare distributions and discuss sample size, variation, and whether the design supports a causal claim.
Print the build card + data table →
Trial times · secondsenter five trials per design
Fill both rows to calculate mean, median, range, and mean absolute deviation.
Watch
The whole loop in 40 seconds
One beetle, one question, one full trip around the loop — no textbook required. Press play.
?!
Why does he tip onto his head?
If threatened, then headstand, because the glands aim upward.
shadow
brush
air puff
shadow 0/5
brush 0/5
puff 0/5
pattern detected →
Claim
Evidence
Reasoning
defense
confirmed
confirmed
The argument
Claim · Evidence · Reasoning
In this classroom, a conclusion isn't a sentence — it's an argument. Every claim you make stands on these three legs.
C
Claim
Your answer to the question, in one confident sentence.
"The Eleodes headstand is a defensive behavior."
E
Evidence
The data that backs it — numbers, observations, measurements. Not vibes.
"Beetles headstood in 80% of shadow trials, and 5% of calm-air controls."
R
Reasoning
The logic that connects evidence to claim — the "because" that makes it make sense.
"The pose aims the abdominal glands at the threat — exactly what a defense should do."
Manipulative 05 · sort the argument
Six sentences from the beetle investigation. Which leg of the argument does each one hold up?
Claim
the answer
Evidence
the data
Reasoning
the because
0 / 6 filed
The official version
The 8 Science & Engineering Practices
The Next Generation Science Standards (NGSS) don't teach "the method" as a checklist — they define eight things real scientists and engineers actually do. You've been doing all eight since elementary school. Now you'll do them on purpose.
SEP 1
Asking Questions & Defining Problems
Wonder, but precisely.
You've done this when your "why?" turns into a "what happens if I change this?"
SEP 2
Developing & Using Models
Build a stand-in for the real thing.
Diagrams, simulations, physical replicas — like our 3D beetle standing in for the real one.
SEP 3
Planning & Carrying Out Investigations
Design a fair test, then run it carefully.
You've done this when you control every variable but one — and write down what happens.
SEP 4
Analyzing & Interpreting Data
Find the pattern hiding in the numbers.
You've done this when a graph makes you say "ohhh, that's what's going on."
SEP 5
Using Mathematics & Computational Thinking
Let math do the heavy lifting.
Averages, rates, spreadsheets, simulations — numbers as a scientific tool, not homework.
SEP 6
Constructing Explanations & Designing Solutions
Explain how it works — or build something that does.
Scientists explain; engineers solve. You'll do both this year.
SEP 7
Engaging in Argument from Evidence
Defend your claim. Nicely. With data.
You've done this when you change someone's mind using a graph instead of a louder voice.
SEP 8
Obtaining, Evaluating & Communicating Information
Read critically, share clearly.
You've done this when you ask "says who?" — and when your poster makes someone else say "whoa."
Practice names adapted from the NGSS Science & Engineering Practices (NGSS Lead States, 2013; NRC Framework for K–12 Science Education, 2012). This unit emphasizes SEP 1, 3, 4, 5, 6 & 7 across 7th and 8th grade.