
Unit 04 · Toolkit · 7th & 8th grade
Measure twice.
Graph once.
Every investigation this year ends the same way: with a number you have to defend. This unit is where that number earns its trust — honest instruments, one estimated digit, repeated trials, and graphs that tell the story straight. One very fast beetle volunteers his personal best. Start with the lesson your teacher names below.
specimen E-01 · 30 cm dash
4.82 s
three timers. one beetle. three answers.
Your route · four lessons
From a reading to a reason.
How can we turn measurements into a graph and a claim someone else can trust? Bring paper, pencil and a metric ruler. Keep your first prediction so you can revise it.
01 · Measure
Give the number a unit.
Choose a tool, repeat a reading and convert the same length.
02 · CompareKeep the unusual reading.
Use mean, median and range to describe what happened.
03 · GraphMake the pattern visible.
Build labeled axes, plot points and explain the flat part.
04 · DefendMake a claim that holds up.
Use a fresh record to graph, calculate, explain and revise.
Doing the two-meeting bridge? Use the three-page paper packet: readings first, graph second. The full investigation and final task extend that route.
Our learning targets and standards
Make a table with units, compare repeated readings, build a graph and support an explanation with numbers. This shared Grade 7/8 toolkit supports middle-school NGSS practices SEP 4 and SEP 5. Scale, Proportion, and Quantity is a supporting connection selected in our curriculum. This unit does not claim a standalone performance expectation or DCI.
Official NGSS practice progression · Official crosscutting concepts
Watch · video companions
Units first. Graphs next.
Manipulative · Spaced repetition
Say it like a scientist
Twenty-six words plus myth cards, on a brain-aware schedule. Flip, type, or match them, listen if you like, and the deck brings each word back right when you're about to forget it. More units join your deck as we unlock them. (It lives in your browser, no account.)
Sketch · sketchnotes
Draw it to know it
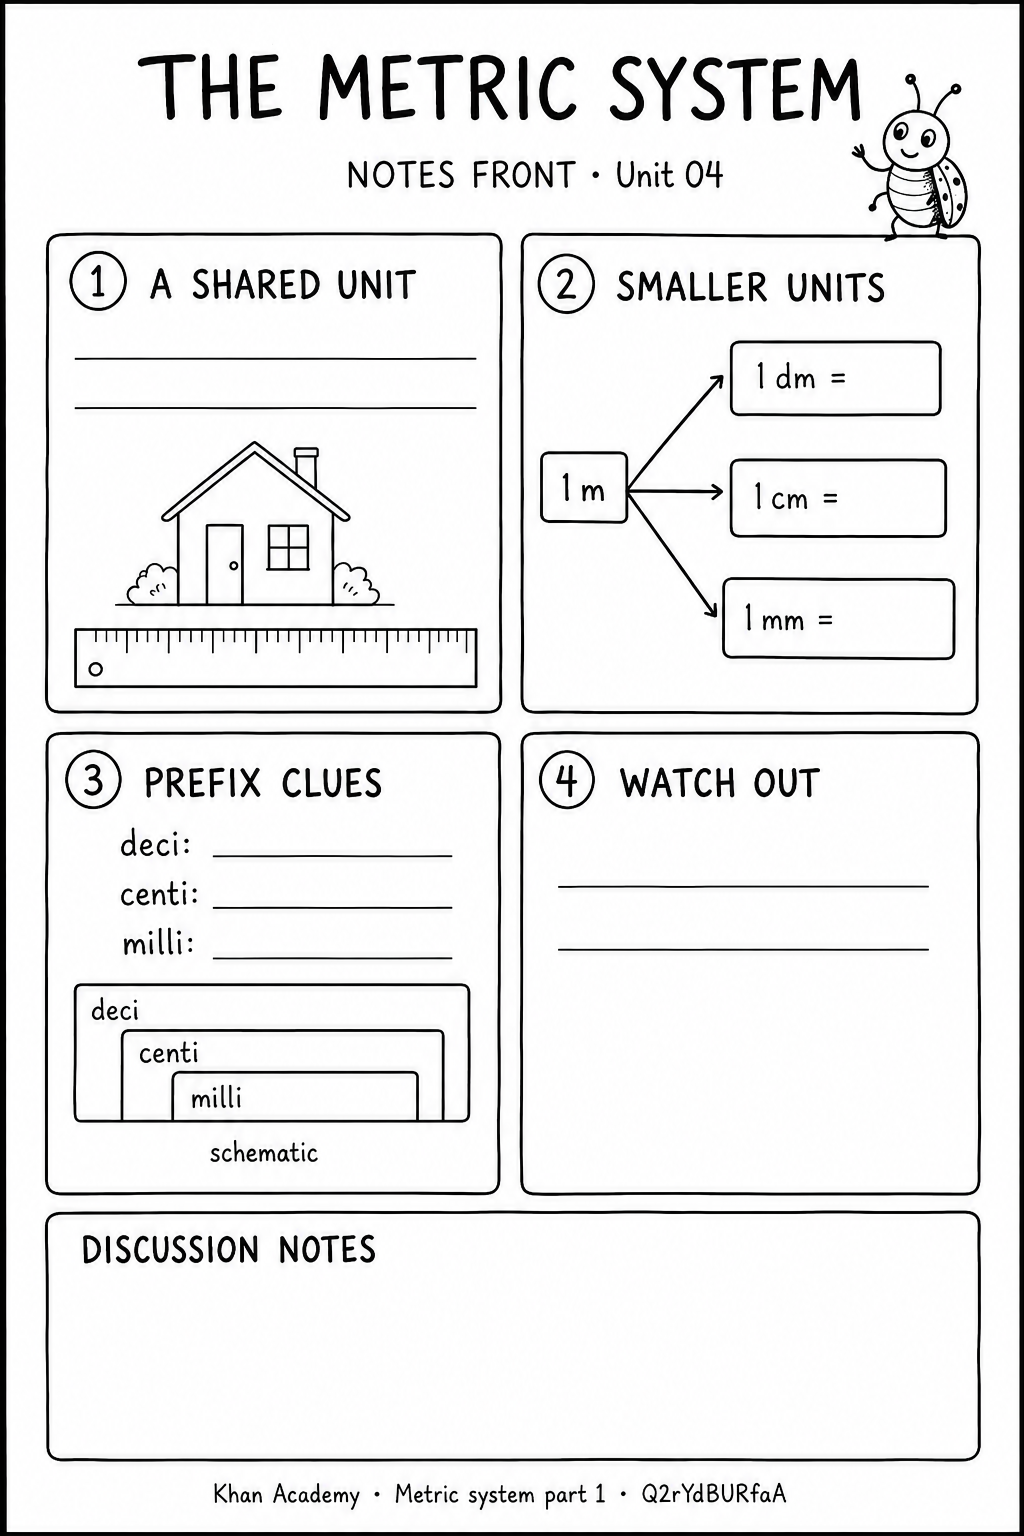
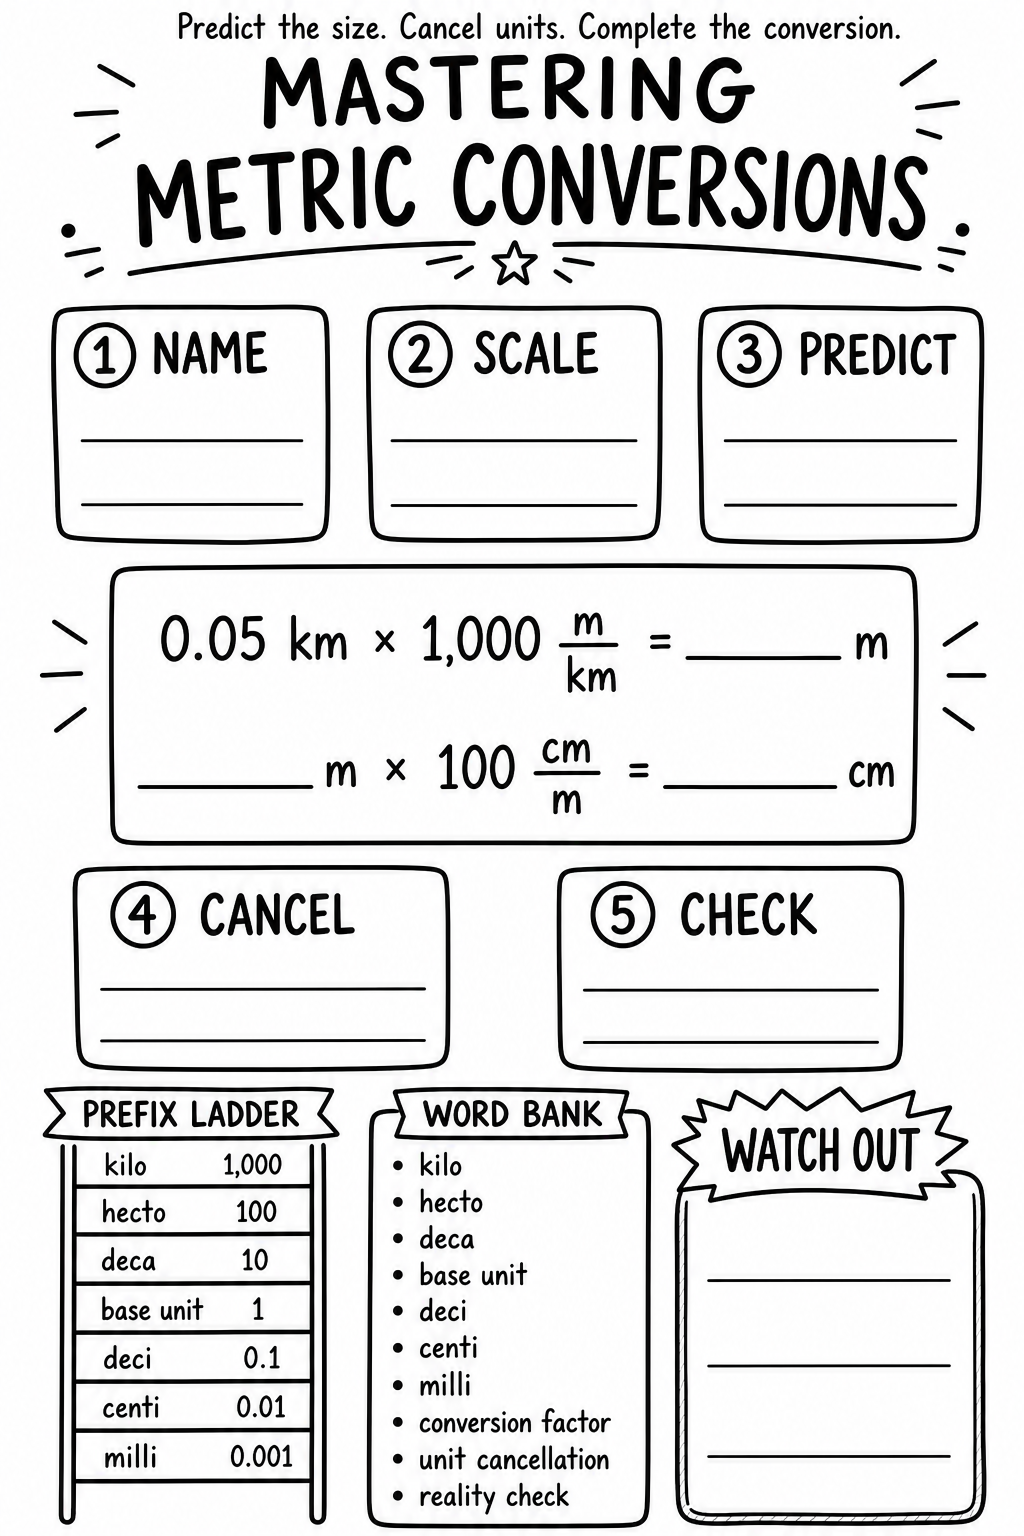
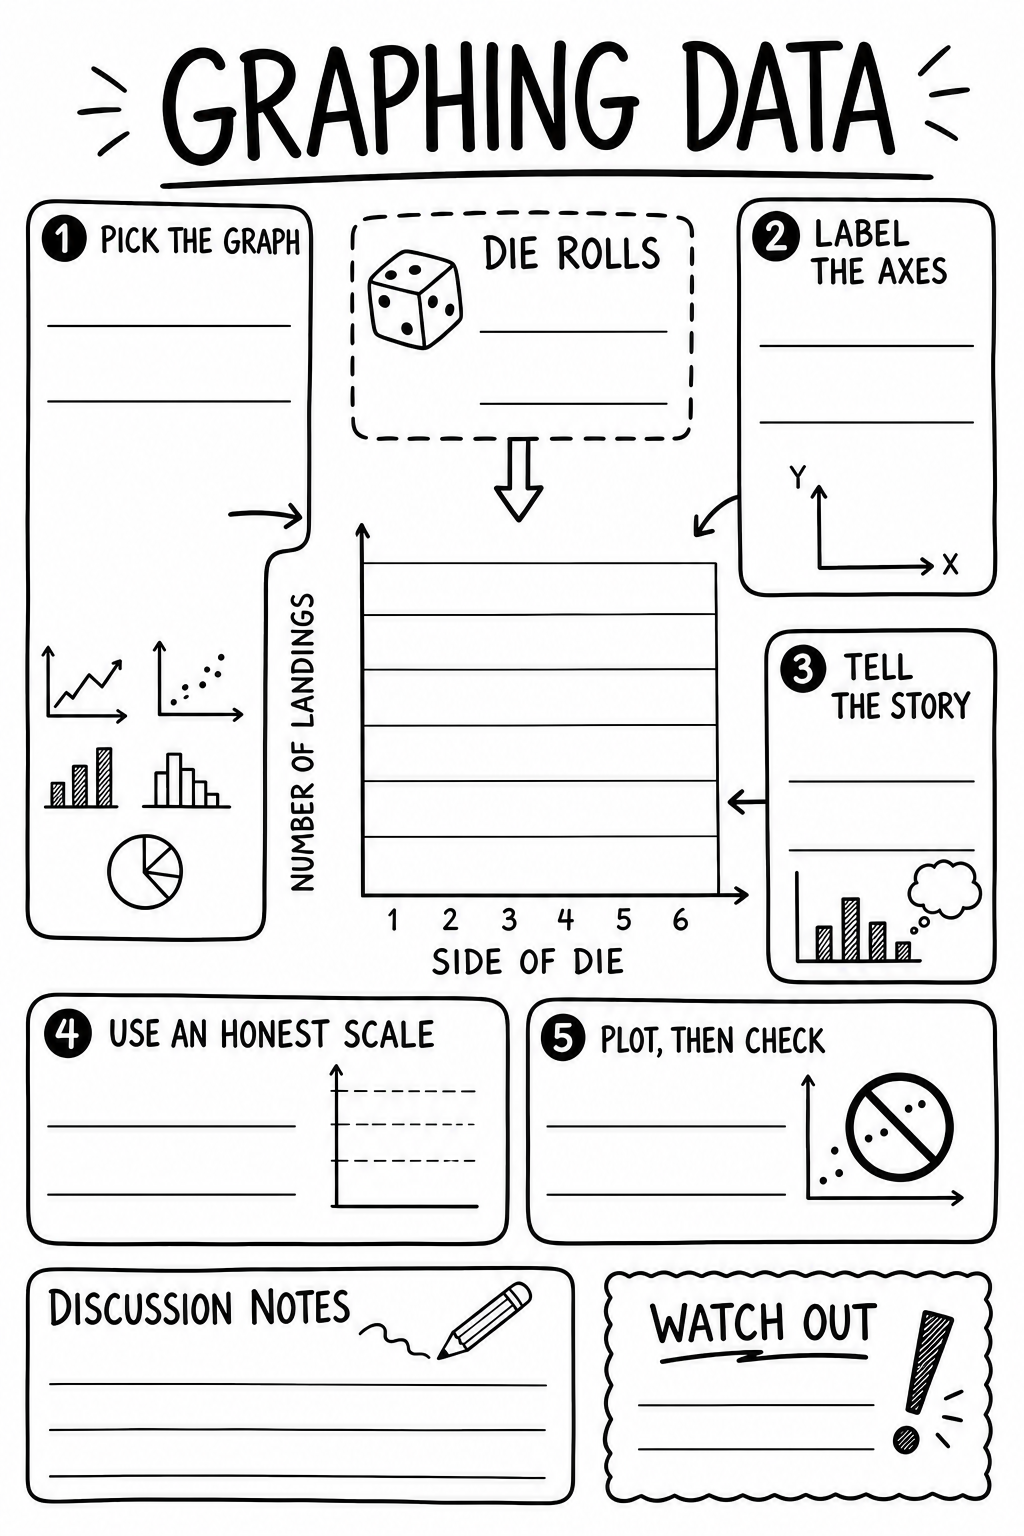
Print the front and back of your assigned notes. Add the ideas during class discussion, then review your thinking with your teacher. Start with metric units; use conversions and the graphing companion when assigned.
Read · Eleo explains
The beetle's commentary track
Read the main idea, follow a worked example, then try it with your own measurement. The videos are optional companions.
A Beetle Is Not a Unit · 2 min read
A number needs a shared unit
Imagine I report that a book is twelve beetles long. Which beetle? A different-sized beetle gives a different count. A shared length unit lets two people compare their measurements. A useful measurement includes a number and a unit: 24 cm tells you more than 24.
One meter, many useful sizes
The meter (m) is the base unit for length. A decimeter is one tenth of a meter, a centimeter one hundredth, and a millimeter one thousandth. A kilometer is 1,000 meters. Prefixes tell you how the unit compares with the meter. Choose a size that makes your measurement easy to read and communicate.
The object stays the same
A 24 cm book edge is also 240 mm long. The book did not grow: smaller units mean more units fit along the same edge. These are authored classroom examples, not measurements taken from the video. Check them with a ruler and the relationship 1 cm = 10 mm.
Agreement is only the beginning
Shared units make comparisons possible; they do not guarantee accurate readings. Line up the zero mark, check the smallest divisions, and read from a consistent position. On an analog scale, record the marks you can read and one reasonable estimated digit. A digital display does not justify inventing extra digits.
Try it on paper
Measure one book edge three times, starting again each time. Keep every reading, including one that seems unusual. Could the tool, alignment or your reading procedure explain a difference? Explain your evidence before changing the record. — Eleo, temporarily retired as a unit of length
Ten at a Time · 2 min read
Same amount, different count
Converting a measurement changes its unit, not its amount. Smaller units require a larger number for the same quantity. Before calculating, predict whether the number should increase or decrease.
A relationship you can use
One meter equals 100 centimeters. So 2.7 m × (100 cm / 1 m) = 270 cm. The meters cancel, leaving centimeters. The ratio compares equal lengths, so it has a value of one. This is an authored worked example using the conversion method in the video.
Count the factors, not the jumps on the page
The full metric ladder changes by a factor of ten at each adjacent rung: kilo, hecto, deca, base, deci, centi, milli. A shortened display skips rungs. From kilometers to meters is a factor of 1,000; from meters to centimeters is 100. Do not treat every visible jump as a single factor of ten.
Reverse the conversion
For 270 cm to meters, use 270 cm × (1 m / 100 cm) = 2.7 m. Centimeters cancel. A larger unit needs a smaller count. Reversing your conversion is one way to check that the amount stayed the same.
Use it, then explain it
Convert your book measurement from centimeters to millimeters and back. Write the unit on every answer. Explain why the book cannot get longer just because its measurement has a larger number. Use the converter below after trying the calculation on paper. — Eleo, same beetle in every unit
Investigate · predict, compare, revise
Make the numbers tell it.
Begin with two paper lessons: compare repeated measurements and build a position-time graph.
Four-lesson investigation · paper first
From measurement to evidence
Measure a book, compare readings, and independently graph a fresh model record. Finish with a claim, two numbers and one limitation.
Open the investigation →Shared skills bridge · authored practice dataYour core paper route
Use the directions organizer, write a prediction, keep units visible and explain one graph. Then continue to your grade’s investigation.
Open the activity →Paper + digital · lesson materials
Paper and screen, together.
Compare repeated measurements and make one graph. Use packet pages 1–3 and the meeting your teacher names.
Open the directions and paper lessons (PDF) · Measurement directions · Graphing directions
The existing math worksheet below is an extension unless your teacher assigns a specific Part.
Practice · Math skills
Honest numbers
The math base camp, on paper: Time Trial statistics, the percent-error leaderboard, conversion reflexes, and the estimated digit. Print the sheet, show your work, review with your teacher.
Myth-busters · tap to flip
Unlearn these three things
Exit ticket · 5 questions
Before you leave the bench
Check five ideas, then explain your thinking in the independent paper task. The quiz is practice, not a complete unit assessment.
question 1 of 5
Lesson 1 · a ruler, a book, a question
Could someone repeat your measurement?
Start with a prediction.
Estimate the length of one book edge in centimeters. Place the book flat on your desk and choose the same two endpoints for every reading.
- Check the ruler's zero mark and smallest divisions.
- Measure the edge, then lift and realign the ruler. Repeat three times.
- Record every reading with cm. For an analog ruler, include one reasonable estimated digit beyond its marks.
- Convert one reading to mm. Explain why the length stayed the same.
Lesson 2 · keep the original record
One unusual number. Two summaries.
Five authored practice times from your paper packet: 4.8, 5.0, 4.9, 8.0, 5.3 seconds. Predict how the 8.0 s reading affects the mean before comparing.
Mean = sum ÷ count. Median = middle value after sorting. Range = maximum − minimum.
Compare the calculations
All five: sum 28.0 s; mean 5.6 s; median 5.0 s; range 3.2 s.
Without 8.0 s: sum 20.0 s; mean 5.0 s; median 4.95 s; range 0.5 s. The extra decimal in the calculated median is not extra instrument precision.
This comparison shows sensitivity to one value. It does not give permission to delete that value.
Lesson 3 · plot, explain, revise
The flat part tells a story.
A model object moves along a straight path. These are authored practice data from packet page 3. Sketch your predicted graph on paper, then build it here.
| Time (s) | Position (m) |
|---|---|
| 0 | 0 |
| 1 | 1 |
| 2 | 2 |
| 3 | 2 |
| 4 | 4 |
| 5 | 6 |
Axis: a line locating values. Scale: the value of each equal interval. Position: where the object is relative to a reference point.
On paper: put time horizontally and position vertically, choose equal intervals, plot all six pairs and add a title and units. Connect successive points to model this time sequence. The connecting segments assume what happens between observations.
Explain: What happens from 2 s to 3 s? Compare the position changes from 0–2 s and 3–5 s. Does graph height alone tell you speed?
After your attempt: explain the evidence
From 2–3 s, position stays at 2 m: the object is stationary in this model. From 0–2 s, position changes by 2 m in 2 s; from 3–5 s, it changes by 4 m in 2 s. The second interval has twice the average speed. The steeper segment, rather than its height, shows this.
We know the recorded positions. Straight lines between them are a modeling choice, not additional measurements. A graph by itself does not explain what caused the motion.
The phenomenon · one dash, three answers
The Beetle Time Trial
Mr. U marks 30 cm of tile. The beetle dashes. Three students click three stopwatches on the same run — and get three different numbers.
4.82 s
timer A · steady thumb
4.79 s
timer B · also steady
5.31 s
timer C · sneezed mid-click
So — whose number is right?
Honest answer: none of them, alone. A single click is a sample, not the truth. Human reaction time is about 0.2 seconds, and it's baked into every one of those numbers. Trust doesn't come from picking your favorite timer — it comes from repeating trials, averaging honestly, flagging the weird ones, and saying exactly how you measured. That's this whole unit in one sentence.
repeat trials
average honestly
flag outliers
estimate one digit
always with a unit
The toolkit · know your instruments
Five instruments and a notebook
Every tool measures one thing, in one family of units, with its own personality of error. Learn the read, learn the unit, learn the catch.
cm
Ruler & meter stick
measureslength
unitscm · m · km
the read0.1 cm + one estimated digit
line up the 0 mark, not the end of the stick. The end gets chewed by backpacks.
mL
Graduated cylinder
measuresvolume
unitsmL · L
the readbottom of the meniscus, eye level
water climbs the walls and makes a smile. Read the bottom of the smile, not the edges.
g
Balance
measuresmass
unitsg · kg
the readzero it first, every time
mass = how much stuff. Weight = gravity's pull on that stuff. Same mass on the Moon — different weight.
°C
Thermometer
measurestemperature
units°C
the readwait for it to settle
it's a thermometer, not a spoon. Never stir with the instrument you're measuring with.
s
Stopwatch
measurestime
unitss · min
the read±0.2 s of human reaction
your brain-to-thumb lag is the error bar. Repeat trials until the lag stops mattering.
✎
Eyes + notebook
measuresobservations
unitsfree
the readwrite it down immediately
the one instrument you can't drop. If it isn't in the notebook, it didn't happen.
Manipulative 01 · the dartboard of truth
Precise is not accurate
Accurate = close to the true value. Precise = close to each other, again and again. You can be one, both, or neither. Pick an arm, throw six darts, and watch the difference land.
pick an arm — it throws six darts.
The four landings
Precise + accurate — tight cluster on the bullseye. The dream.
Precise, not accurate — tight cluster, wrong neighborhood. A calibration problem: the tool is off, consistently.
Accurate-ish, not precise — scattered around the truth. Averaging rescues this one.
Neither — scattered AND off-center. Check the tool, then the human.
The estimated digit
The marks give you 4.3. Your eye honestly estimates the next digit: 4.35. That's the estimated digit — exactly one, never two. Writing 4.35271 cm isn't more honest. It's just lying with extra digits.
Manipulative 02 · powers of ten
One system, ten at a time
The metric system has exactly one trick: every step on the ladder is ×10 or ÷10. Converting units isn't math — it's just sliding the decimal. This is the crosscutting concept Scale, Proportion, and Quantity baked directly into units.
km×10 →
hm×10 →
dam×10 →
m×10 →
dm×10 →
cm×10 →
mm
King Henry Died By Drinking Chocolate Milk — B marks the unprefixed unit on this classroom ladder: meter, gram or liter. The meter is the base unit for length; not every unprefixed unit is an SI base unit.
4.2 cm = 42 mm
1 step toward smaller units · ×10 · decimal slides 1 place right
Manipulative 03 · the lab
The Time Trial Board
Run the beetle's 30-cm dash as many times as you like. Every trial lands in the notebook — and the stats update live. Watch what one snack break does to the mean, and how the median may respond less to one extreme value.
The 30-cm dash · specimen E-01
0.00 s
0102030 cm
the beetle is simulated; the statistics are real. Human reaction time (±0.2 s) is baked into every trial — just like your thumb.
Field notebook
| # | time (s) | note |
|---|---|---|
| your trials will land here | ||
0trials
—mean
—median
—range
the outlier grabs the mean (μ) — the median (M) is often less affected by one extreme value.
REPORT
Say it like a scientist
Locked — run at least 8 trials and the board will write your report sentence for you.
Manipulative 04 · make the numbers talk
Graphs that tell the truth
A data table is honest but quiet. A good graph makes the pattern tap you on the shoulder. First the checklist, then the game: which graph tells which story?
✓
Title says what's plotted. For an experiment, the x-axis often shows the variable changed and the y-axis the response. For a time series, time usually goes on x. Let the question guide the labels.
✓
Label quantities and units on numerical axes. Equal numerical steps need equal spacing. Category labels, such as material names, do not need measurement units.
✓
Use a trend line for an overall scatter-plot relationship when justified. Connect successive observations for a time sequence when that model makes sense; do not connect unrelated categories.
For scattered measurements, compare these schematic drawings. A trend line summarizes the pattern without treating every wiggle as a real change.
sort the stories — which graph tells each one?
Pick a story, then file it under the right graph.
Line graph
change over time
Bar graph
compare groups
Circle graph
parts of a whole
0 / 6 graphed
Crosscutting Concept: Scale, Proportion, and Quantity — the lens of this whole unit (NGSS Lead States, 2013). There's no standalone "measurement" standard at middle school because measurement lives inside every investigation: it returns at MS-PS2-2 (forces) and MS-PS3-1 (energy) this very semester. Practices it feeds: SEP 4 & 5.